
Network Dashboard
Monitor multiple motion platforms across a local network from a single supervisor PC.
1 Introduction
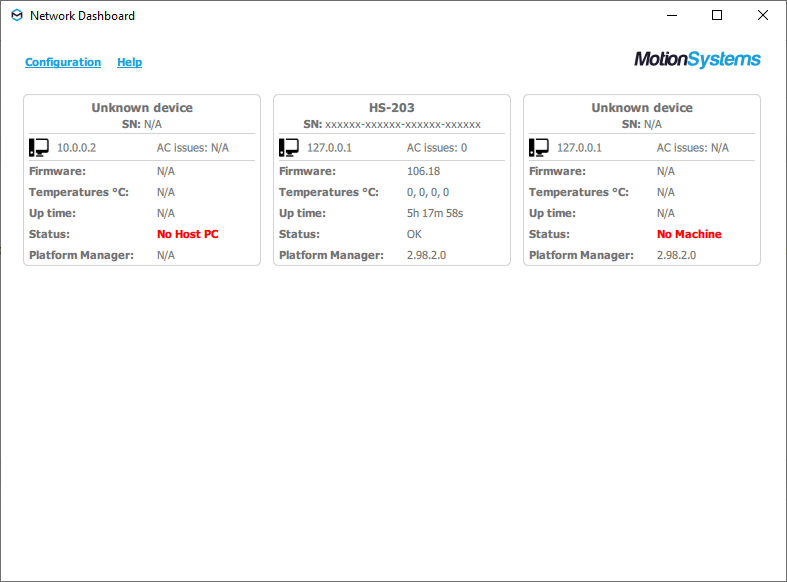
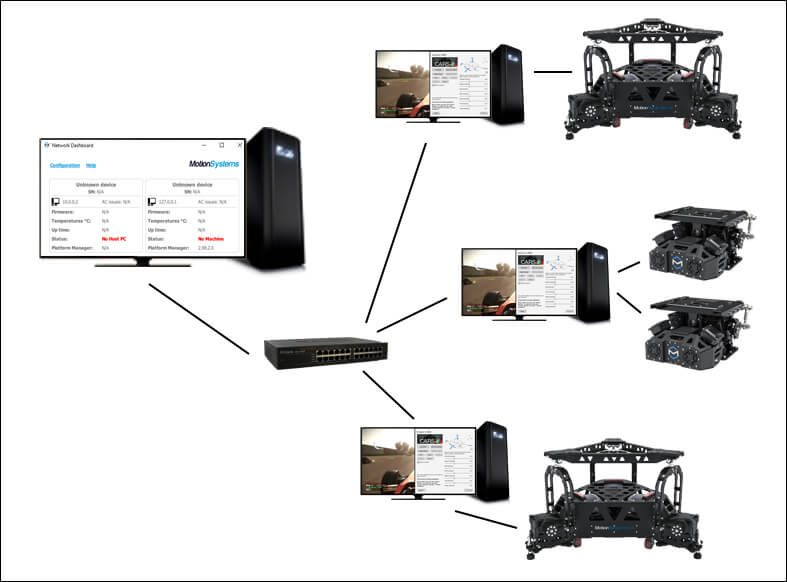
Network Dashboard is an utility software that may be very useful to manage a large number of active devices in one place. It allows you to check working statuses of the motion platforms in your facility, monitor its temperatures and up-times. It also notifies about pending Action Center issues that require your attention. Only a single supervisor PC is required - client computers must be connected to the same local network. The Network Dashboard always installs with ForceSeatPM.
2 Configuration
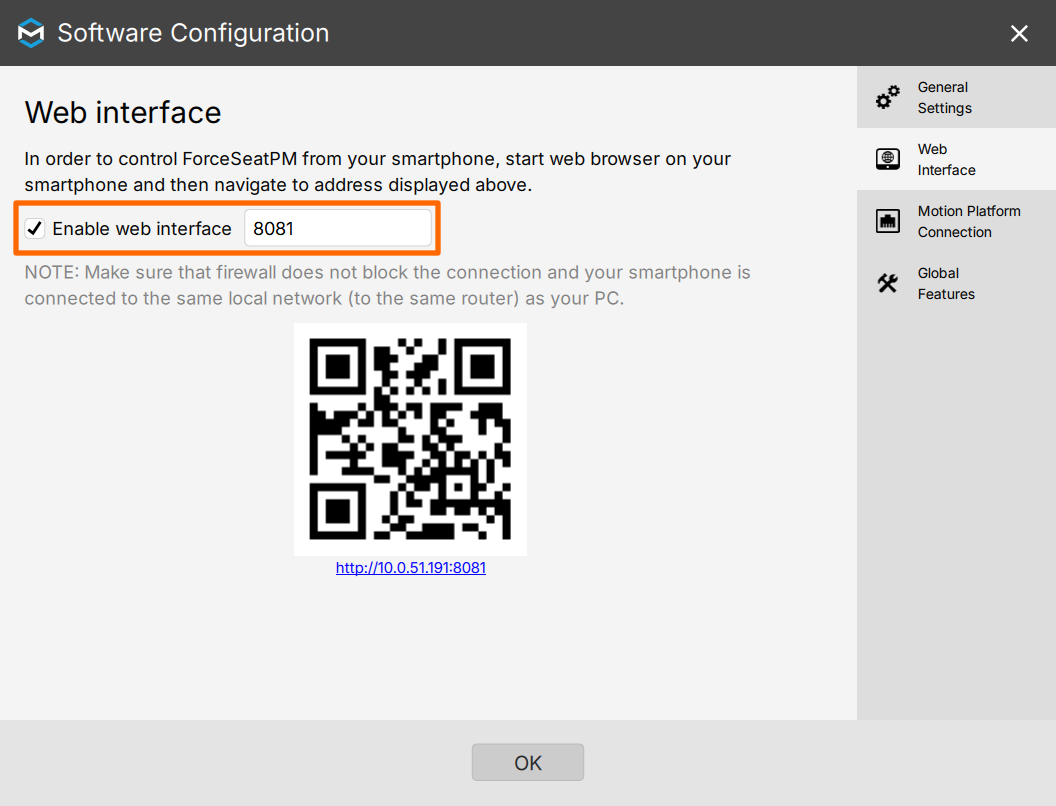
In order for the Network dashborad to work, the network must be configured correctly and all computers and routers must be turned on and connected to local network. Also, ForceSeatPM must be running on every computer, Web Interface must be enabled in ForceSeatPM (you can enable it in Software Configuration window) and Windows firewall does not block incoming web interface connections (by default TCP port 8081 is used).
Having all set, Network Dashboard application is ready to launch. It establishes connection with ForceSeatPM instances that are running on the other computers and continuously monitors connected devices.
3 First launch
After the first launch default configuration.ini file is created. It defines IP addresses of other computers
and expected number of devices connected to each one. The configuration file can be opened directly from
the application by clicking Configuration link that is placed at the top left window corner.

The content of the configuration file is as follows:
[10.0.0.1] ; change to the correct ip address of your host computerPort=8081 ; change to the correct port numberDeviceCount=1 ; set number of devices that are connected to the host pc [10.0.0.2] ; change to the correct ip address of your host computerPort=8081 ; change to the correct port numberDeviceCount=1 ; set number of devices that are connected to the host pcEvery slave computer entry consists of IP address, connection port and number of connected devices. You need to change default values and enter real data that will allow to establish network connections.
Let's set an example: there are two 2 slave computers in the local network at the following IP addresses 192.168.1.101 and 192.168.1.139. PC #1 is expected to work with 3 devices, PC #2 with only 1. The configuration file for such setup would be as follows:
[192.168.1.101]Port=8081DeviceCount=3 [192.168.1.139]Port=8081DeviceCount=14 Device information
Every single device listed in the application has a visual representation with a set of specific data that can be very useful to monitor, diagnose and deal with potential problems. Usually it will only show software update notifications in Action Center but having plenty of running devices at the same time may be very demanding.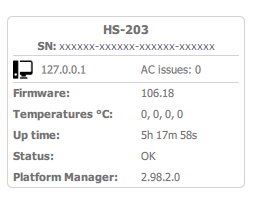
4.1 Available data
- device name
- serial number
- host IP address
- not resolved Action Center issues that require your attention
- firmware version
- device components temperatures
- up time (time since the device was powered ON)
- status
- OK - everything is OK
- No Machine - device is not connected to PC
- Error - has to be inspected directly on the specific PC
- No Host PC - computer specified in
configuration.inifile is not available - N/A
Last updated: 2026-04-23